Struggling In Master Excel For Data Analysis?
Following my 6-STEP framework.
Simpler, Smarter, Faster. Not harder.
Streamlining your learning process is my passion. Let me do it for you.
READ MORETHE FIRST THING YOU NEED TO KNOW
Four Ways to Accelerate Your Excel Learning
Don't go down the wrong path again.
Staying Focus.
Focus on learning what you need, and ignore what you won't use. You should focus on the 20% of the scope that brings you 80% of the outcome.
Using Framework.
Simplify and solidify your learning with a strong framework, boost memory, and recall information when necessary.
Understanding Context.
Truly understand the relationships of functions and features. It can strengthen your learning by connecting your knowledge and experience. That's the foundation of applications.
Solving Real-World Problems
Problem-solving is the ultimate goal of learning and applying Excel. You should gain experience by practicing and solving real-world problems. The more you solve, the more you enhance your skills.
Read MoreWHY EXCEL ANALYTICS
Hi, I'm Sun.
Hey there! In today's business world, Excel skills are a must for you. Excel is like a super-tool that can help you work with data, simplify tasks, and make smart decisions.
When you master Excel, you gain the power to handle data, crunch numbers, create charts, and uncover trends. Whether you're running a business, working as an analyst, or aiming to boost your career, Excel can be a game-changer.
So, why should you consider mastering Excel? Here are the key benefits that await you:
1. No More Waiting for Reports:
Ever been frustrated by slow reports? I understand. Sometimes, you need information quickly, but it takes too long to get it. Waiting isn't your style, so why not learn to generate reports yourself?
2. Clearer Data Insights:
Understanding your business inside and out is crucial. Dive deep into it and discover the best ways to interpret data. You want reports that make sense to you and make your work smoother.
3. Effective Data Communication:
Learning the language of data is real and invaluable. Excel introduces you to various data concepts, boosting your confidence when communicating with data experts.
Let's embark on this journey together to enhance your Excel skills and transform your data capabilities. Excel goes beyond numbers. It transforms how you work with data, making you a standout in data analysis.
----------------
Education: MSc in Business Analytics, MSc in Management (Operation Management), BA in Marketing and Management, ADip in Marketing and Retail Management
Qualification: Registered Lean Leader, RLL
Recognition: Top Voice in Data and Business Analysis (Linkedin Community)
READ MORELEVERAGE MY PRACTICAL EXPERIENCE
How Do I Help You?
I've innovated a new approach to teach you data analysis using Excel
- I've spent hundreds of hours reorganizing the learning flow, so you don't need to explore it on your own.
- I put all together and frame it using my unique 6-Step Framework. You won't find it anywhere else.
- I select the most useful functions and features for you, focusing on data analysis.
- I teach you in simple, short tutorials. You can study anytime, anywhere.
- I help you to master Excel Analytics in ONE single course.
Simpler, Smarter, Not Harder
Turning you from Beginner into Confidence Excel Professional.
Read MoreTHEME-BASED LEARNING EXPERIENCE
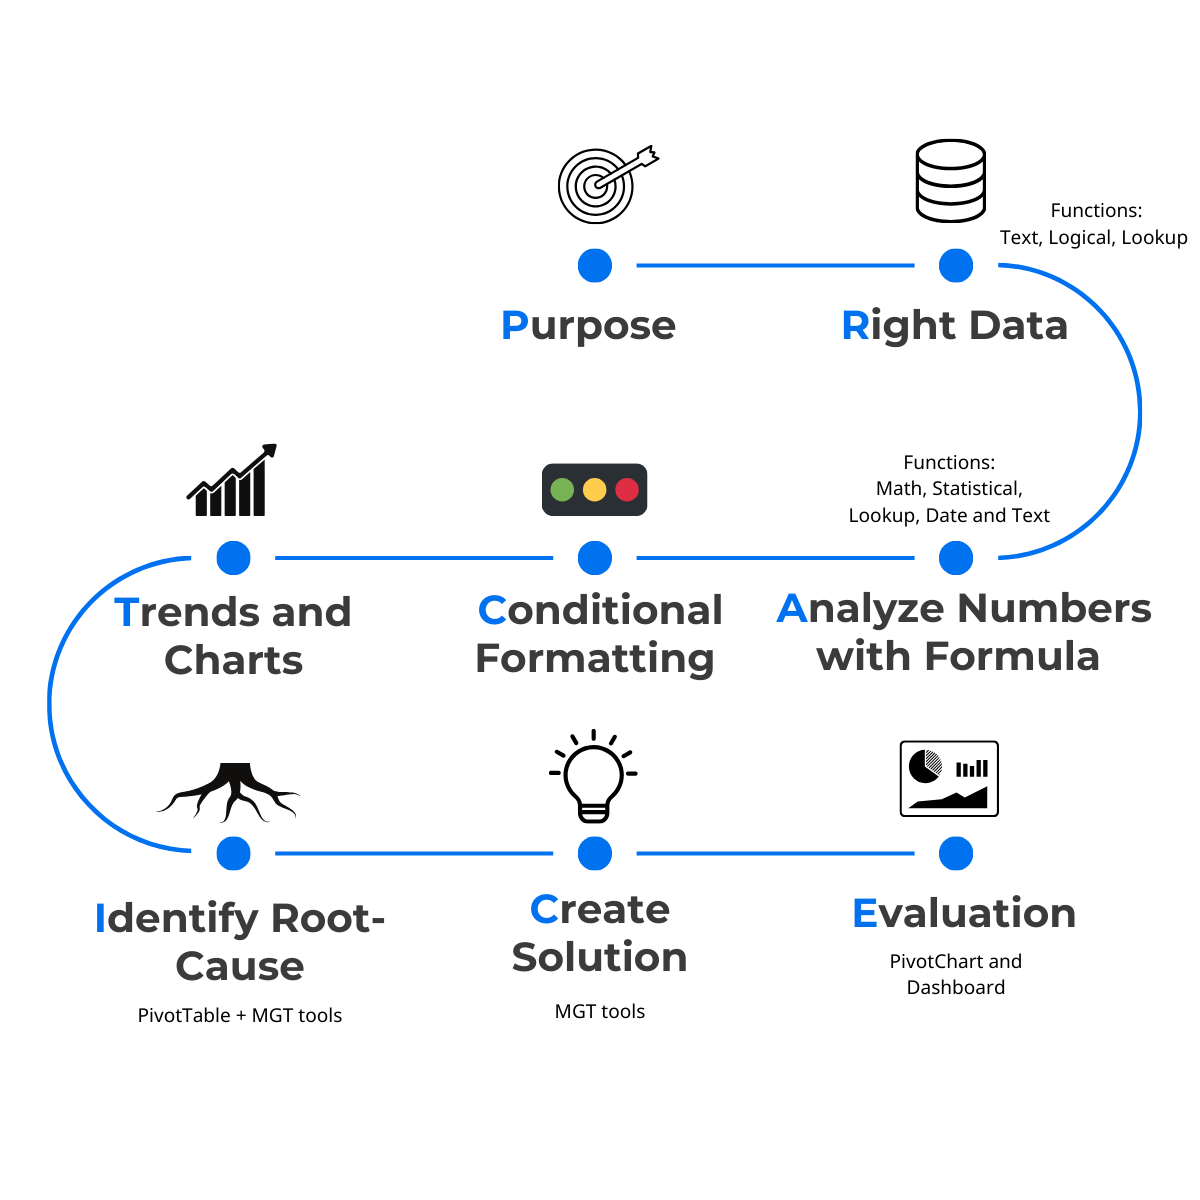
Follow My 6-STEP PrACTice Framework
Start your learning journey with me. You'll learn corresponding functions and features along with a business analysis theme.
Completed the course, You May…
- Master Excel for Data Analysis
- Build Strong Excel Foundation
- Establish Analytics mindset
- Earn back learning time
You won't just learn practical skills. You'll also look forward to a brighter future. Don't pass up this opportunity to improve your data analysis skills and open up exciting possibilities.
Let's explore it all in Excel Analytics OS.
EXCEL ANALYTICS OS
What's in the course?
It includes 8 modules with 120 lessons totaling 7.5 hours. Take a look at the core contents. Don't worry, you can learn them all with my guidance.
STEP 1
Purpose
Always begin with a clear purpose. Keep this in mind. Don't allow this common problem to slow you down.
Heading in the wrong direction can be a real mess. But, at the end of the day, there are just two things that truly matter: Problems and opportunities.
STEP 2
Right Data
Once you've got your purpose in mind, the next move is to create the Right Data Set.
Core Excel Contents:
- Logical functions: IF / Nested IF / IFS / IFERROR / AND / OR etc.
- Lookup functions: XLOOKUP / VLOOKUP / HLOOKUP / INDEX / MATCH etc.
- Text split functions: TEXTSPLIT / TEXTBEFORE / TEXTAFTER / LEFT / MID / RIGHT
- Text join: TEXTJOIN / CONCATENATE / CONCAT / & etc.
- Text format: TRIM / UPPER / LOWER / PROPER / TRANSPOSE / TEXT / VALUE
- Find and replace: FIND / IF + FIND / SEARCH / SEARCH + COUNT / SUBSTITUTE
- Powet of "TABLE"
STEP 3A
Analyze numbers with formula
Now that you've got your right data set, let's move on to the ACT with "Analysis."
Core Excel Contents:
- Date functions: DATE / TODAY / YEAR / MONTH / DAY / WEEKDAY / WEEKNUM / EDATE / EOMONTH
- Math functions: SUM / SUMIF / SUMIFS / SUM+* / SUBTOTAL / AGGREGATE
- Statistical functions: AVERAGE / AVERAGEIF / AVERAGEIFS / COUNTA / COUNT / COUNTIF / COUNTIFS / MIN / MINIFS / MAX / MAXIFS / TRIMMEAN / MODE / MEDIAN / RANK
- Lookup functions: FILTER / SORT / SORTBY / UNIQUE
STEP 3B
Conditional Formatting
Now that you've got your right data set, it's time to ACT with "Conditional Formatting."
Core Excel Contents:
- Highlight Cells Rules - Spotlight on specific data
- Top / Bottom Rules - 80/20 rules
- Data Bar - Speedy comparision
- Color Scales - Heat map
- Icon Sets - High level classification
- New Rules - Spotlight based on your formula
- Custom number format
STEP 3C
Trends and Charts
Now, with your well-prepared data set, let's dive into the ACT with "Trends and Charts."
Core Excel Contents:
- Create dynamic charts with Table and Slicers
- LINE CHART: Automatically highlight min/max
- LINE CHART: Add average line
- LINE CHART: Dynamic Chart Model (XLOOKUP/VLOOKUP)
- LINE CHART: Dynamic alert and trendline
- LINE CHART: Record external factors / Story telling
- BAR CHART: Introduction - 5 Key benefits
- BAR CHART: Auto-Sorting / Auto-updating (Part 1)
- BAR CHART: Build flexible chart by adding switches (Part 2)
- BAR CHART: Conditional bar chart
- BAR CHART: 100% Stacked column
- COMBO CHART: Add target line and marker
- COMBO CHART: Add % change in Combo Chart
- Sparklines: Quick analysis
STEP 4
Identify Root-Cause
Now that you've made some findings, it's time to spot roadblocks.
Core Excel Contents:
- Create and refresh PivotTable with "Excel Table"
- Core operations concept: Dragging Rows / Columns / Values / Filters
- Exercise: Dragging Fields in PivotTable
- Useful features: Set color/ number format / disable auto-width adjustment
- Useful features: Slicers and Timeline
- Useful features: Grouping
- Useful features: Summarize value by / break down raw data
- Useful features: Show value as / Duplicate value column
- Useful features: Add simple calculated field
- *** Drill down analysis: Multiple layers and conditional formatting
STEP 5
Create solutions
Now that you've gathered your insights, it's time to craft solutions. In this module, you'll discover:
- Introduction - Create solution
- Set clear goals for your solution
- Well organizing your analytics project via 6-Step framework
- Concise communication to stakeholders
- Prioritize resources to your solution
- Wrap up - Create solution
STEP 6
Evaluation (Measure, Review and Adjust)
Now that you have your solutions ready, let's move on to the next step: using Dashboards to assess the results.
Core Excel Contents:
- Introduction - Evaluate by Pivot Dashboard
- Part A - Concept and preparation for Pivot Dashboard
- Ingredients of Pivot DASHBOARD
- LOOKUP functions: GETPIVOTDATA
- GETPIVOTDATA in a simple way
- PivotChart - Create a chart
- PivotChart - Connect multiple data sources through relationships
- PivotTable - Top#/Bottom#/Less than/Greater than
- Charts and Shapes - Formatting and controls
- Part B - Prepare to build a DASHBOARD
- Dashboard practice 1: Add data lists in data model
- Dashboard practice 2: Create the puzzles one by one
- Dashboard practice 3: Put the puzzles together
+
*** BONUS MODULE *** (Expected delivery date: 31 Oct 2023)
Dashboard Tricks
Now that you've got the hang of creating basic Dashboards, it's time to level up and build ones with even more flexibility. In this module, you'll explore:
- Using formulas and charts to craft dynamic Dashboards.
- Applying a mix of everything you've learned throughout the course for real-world scenarios.
*** BONUS PRODUCT Selling Price: USD 99 ***
Excel Analytics Muscle Builder 110+
With your "6-Step OS", the next step is to build analytics muscles. Now, you are able to follow:
- Advanced applications
- Useful tips and tricks for analysis in 6 pillars
- 6 Pillars: Functions, PivotTable, Charts and shapes, Conditional formatting, Features, Shortcuts
This Course Is For You If...
- You struggle to master Excel for data analysis.
- You don't know how to apply in real-world.
- You don't know where to start learning.
- You don't know how to start learning.
- You want to master Excel in ONE course.
IN CONCLUSION
Connected Experience And Knowledge
A shortcut awaits you.
I'll share my 20 years of Data Analysis experience, focusing on what works and skipping what I haven't used. My proven shortcut is now yours.
Thanks for your time, I hope to see you in my course.
ENROLL NOWJoin the global student community from 27 countries.
Australia, Austria, Cambodia, Canada, China, Fiji, France, Germany, Greece, Hong Kong, India, Indonesia, Kuwait, Mozambique, Netherlands, New Zealand, Nigeria, Oatar, Portugal, Romania, Saudi Arabia, Spain, Sweden, United Arab Emirates, United Kingdom, United States, Venezuela.
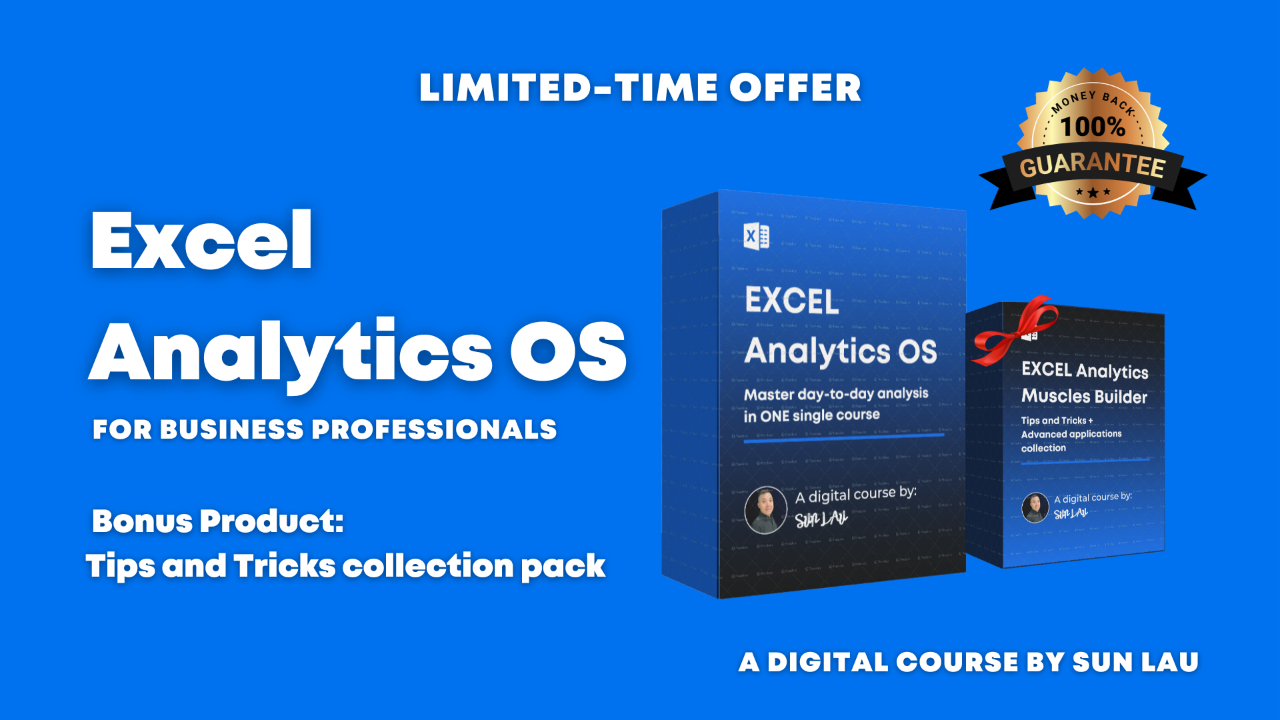
Total Value: $714. Limited-Time Offer
USD $120 (one-time payment)
Get started with ZERO risk. 30-day money back guarantee. No recurring payment and extra fee. Lifetime access and ongoing updates.
Limited-Time Offer for $120 plus a Bonus Product