Sharpen Your Irreplaceable Excel Skills for Business Analysis
A systematic, 6-step blueprint designed for non-technical professionals to turn messy data into executive-level insights.
IT'S TIME TO STOP STRUGGLING WITH EXCEL
Do You Recognize These?
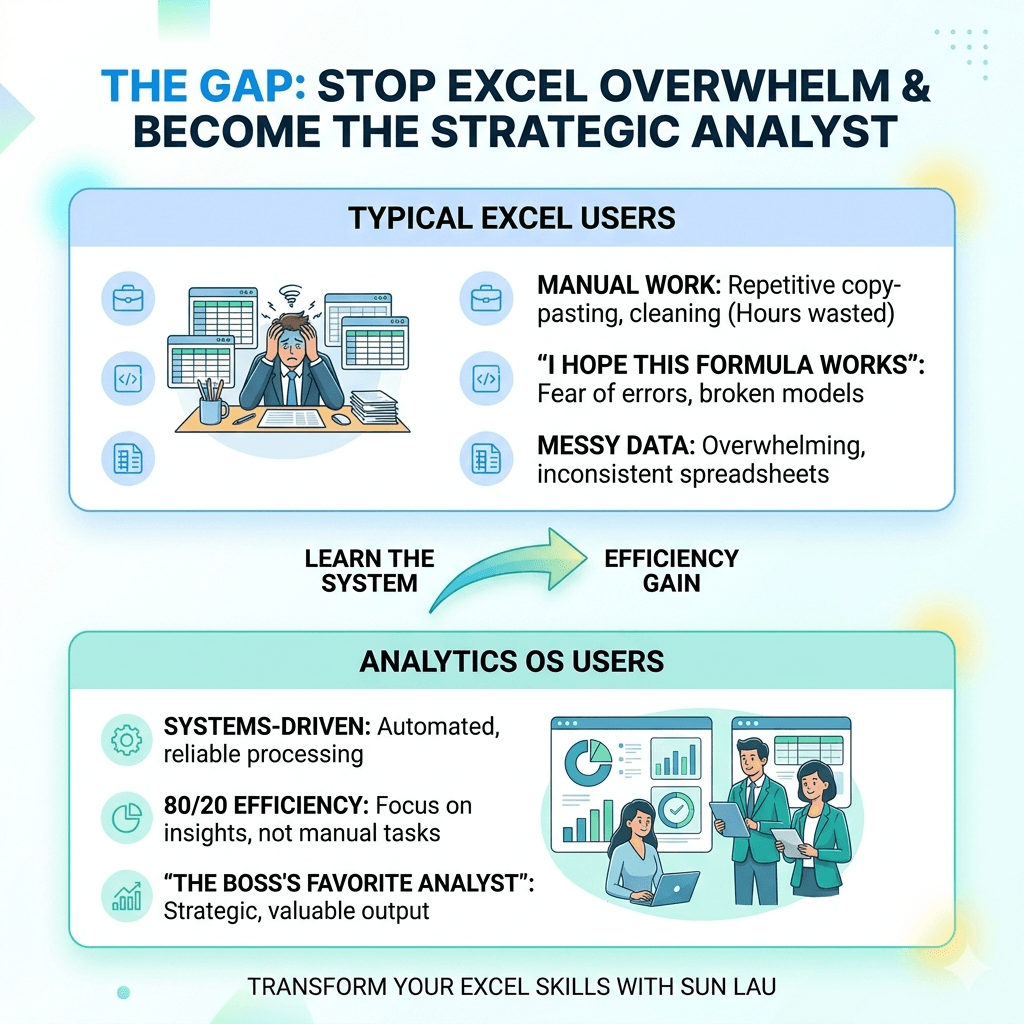
Spending 4 hours on a report that should take 15 minutes?
The 'Fear of the Broken Formula' when presenting to your boss?
Feeling like you know the functions, but don't know how to build the system?
I understand—because I was once in your position. That’s exactly why I built this course.
And yes, you can completely turn things around after completing it.
WHY EXCEL ANALYTICS OS
Hi, I'm Sun.
I help you to master Excel for business data analysis. Simpler, smarter, and easier.
20 years ago, I thought Excel was easy. I took typical courses, clicked buttons, copied formulas, and followed step‑by‑step guides.
It felt simple… at first.
Then I got stuck — badly.
I realized using Excel for real business data was a completely different skill.
I struggled to consolidate data, hated repetitive manual work, couldn’t build analytic models, and barely created clear charts for management.
I underestimated how to apply Excel properly for business.
I wanted a systematic way to learn — but no one could teach me.
So I spent decades building my own proven blueprint for Excel mastery.
I don’t want you to waste years on the wrong path like I did.
That’s why I built this course.
If you want to know more on Excel Analytics OS Course, keep reading👇
----------------
Education: MSc in Business Analytics, MSc in Management (Operation Management), BA in Marketing and Management, ADip in Marketing and Retail Management
Qualification: Registered Lean Leader, RLL
Followers on Social Media: 260k (LinkedIn, FB, IG, Threads, TikTok, XHS, YouTube,)
Favikon Creator's Ranking: #1 - Excel and Office Productivity (Hong Kong) 2025

WHY THIS COURSE
How Is This Course Different?
100% Focus On Business Data Analysis
Excel isn’t just for data storage or basic math. My 20 years of experience helps you unlock real business value.
Proven 6‑Step “PrACTice” Framework
Everything fits into a clear, memorable system you can apply immediately.
Understand the "WHY" and "WHEN" to use functions
Master the logic — not just the steps — so you never forget.
Understand the "WHY" and "WHEN" to use functions
Master the logic — not just the steps — so you never forget.
80/20 Rule - Simplicity
I teach the top 20% of functions that solve 80% of real‑world problems.
"0" Fluff and Focus on What Matters
No filler, no gimmicks, no distractions — only what actually moves the needle.
This isn’t just another Excel course full of random functions.
It’s a structured system that gives you the exact skills you need for real business data.
WHAT'S INSIDE?
Course Curriculum
(The 6-STEP System)
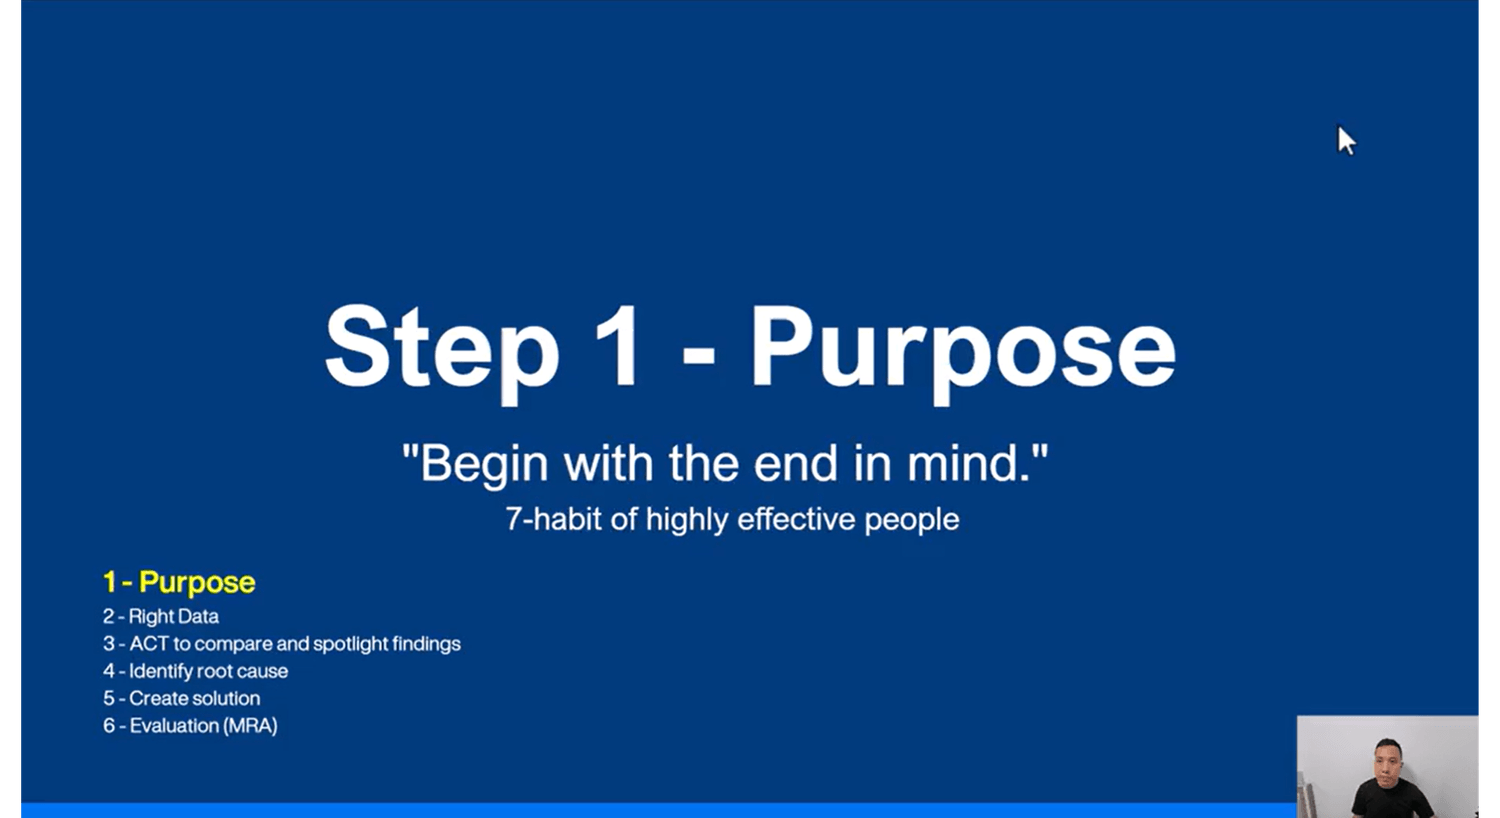
STEP 1: Purpose
4 mins
Purpose: The Strategic Mindset (Stop wasting time on the wrong data).
First, we'll build a strong foundation by recognizing how crucial clarity is in your Excel projects. This ensures you're on the right track.
Where the project begins
Identify problems and opportunities
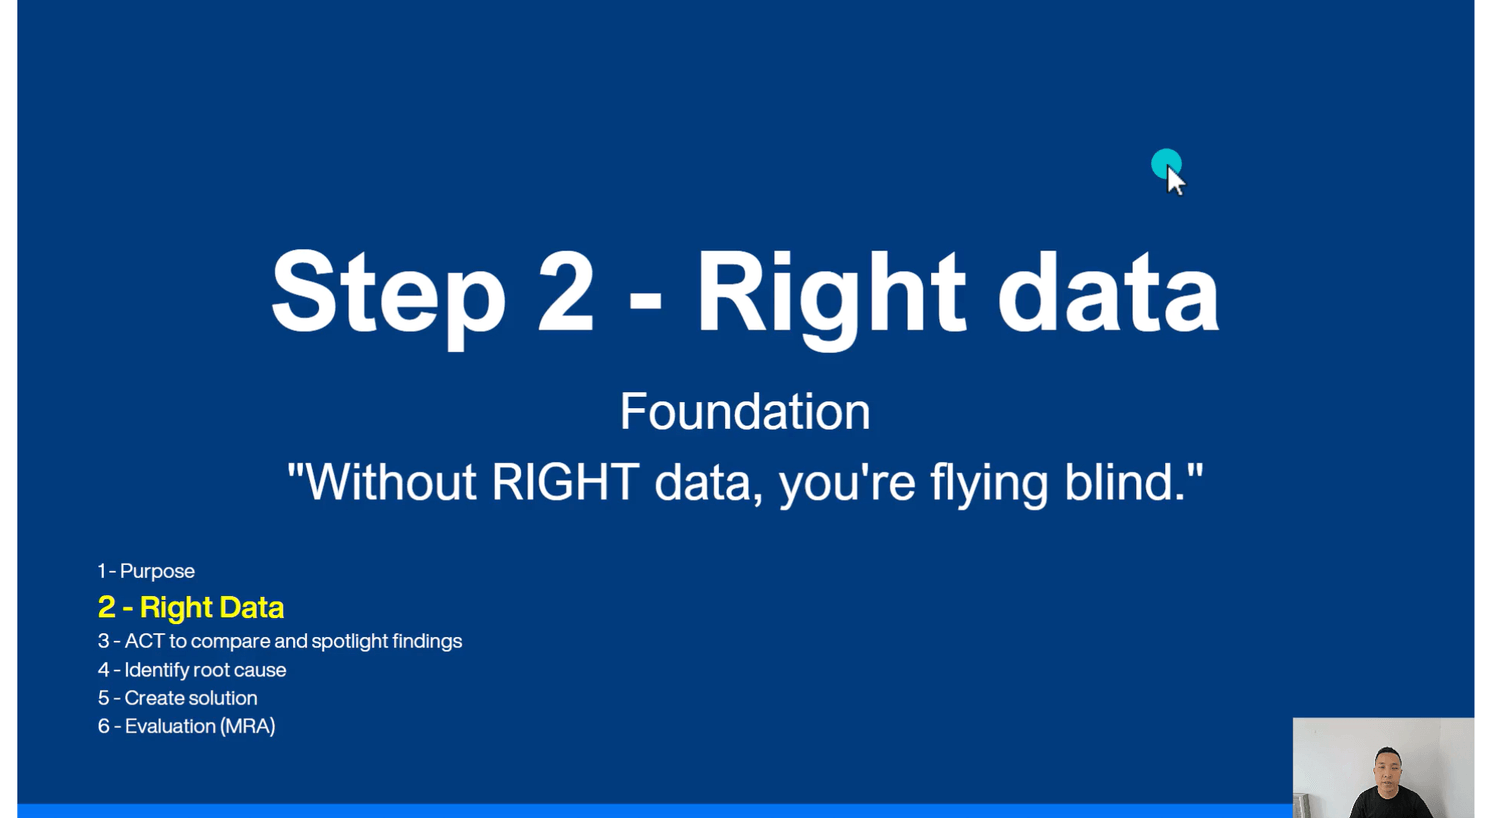
STEP 2: Right Data
1 hr 20 mins
Right Data: Clean & Structured (The 40 functions that do 90% of the work).
Next, we'll learn about 40+ logical, lookup and text functions for business data structuring and cleansing, including:
Lookup functions: XLOOKUP / VLOOKUP / HLOOKUP / INDEX + MATCH
Logical functions: IF / IFS / IFERROR / AND / OR
Text split functions: TEXTSPLIT / TEXTBEFORE / TEXTAFTER / LEFT / MID / RIGHT
Text format functions: TEXTJOIN / CONCATENATE / TRIM / UPPER / LOWER / PROPER / TRANSPOSE / TEXT / VALUE
Find and replace functions: FIND / SEARCH / SUBSTITUTE
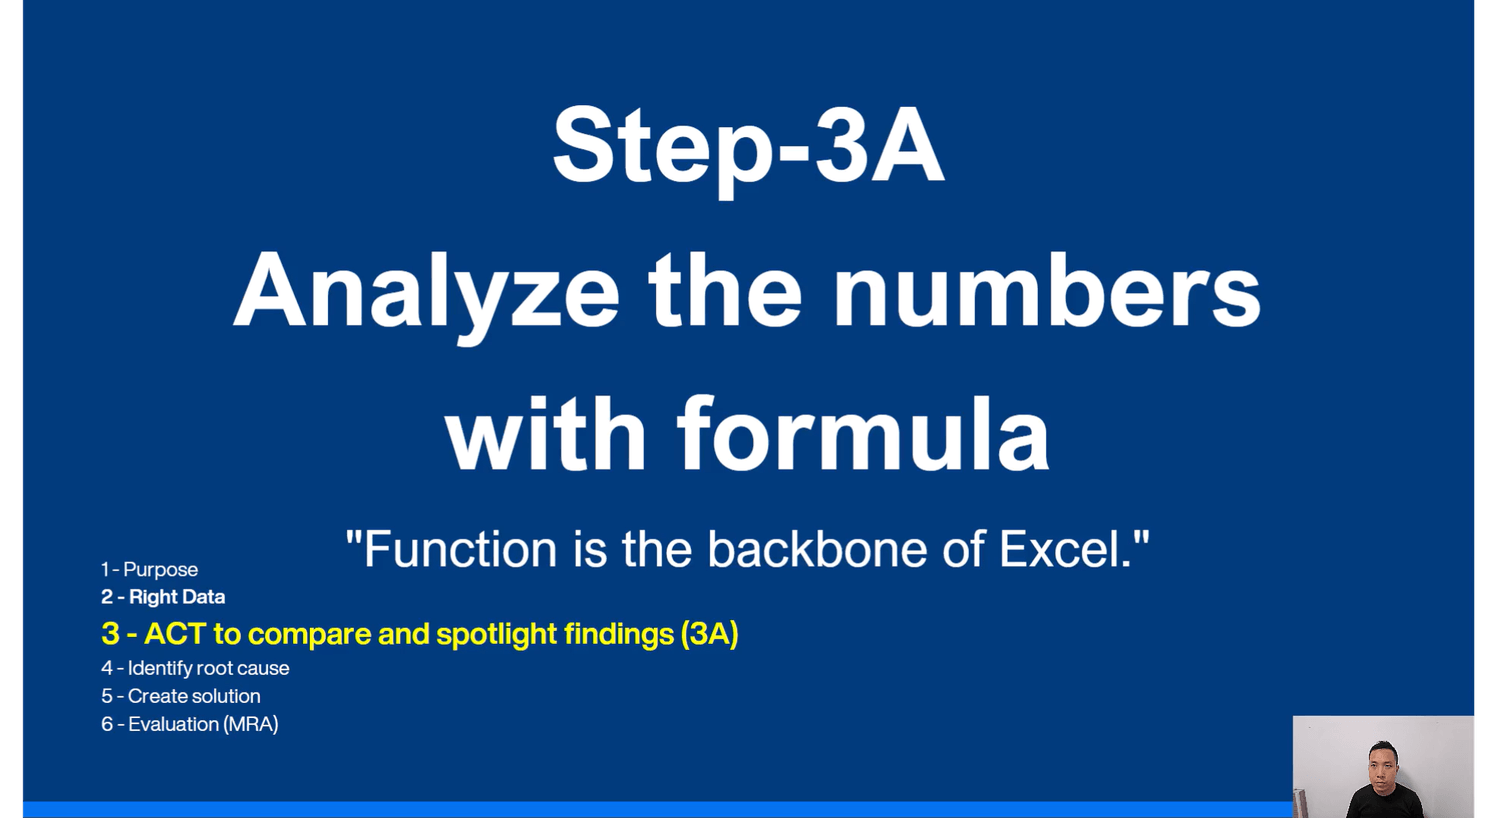
STEP 3A: Analyze numbers with formula
1 hr 15 mins
Analyze & Spotlight: Finding the "Why" (XLOOKUP & Dynamic Arrays).
Then, we'll learn 30+ date, math and statistic functions for business data analysis, helping us identify insights for informed actions, including:
Calculation functions: SUM / SUMIF / SUMIFS / SUBTOTAL / AGGREGATE / COUNT / COUNTA / COUNTIF / COUNTIFS / MIN / MINIFS / MAX / MAXIFS / TRIMMEAN / MODE / MEDIAN / RANK
Date functions: DATE / TODAY / YEAR / MONTH / DAY / WEEKDAY / WEEKNUM / EDATE / EOMONTH
Lookup functions: FILTER / SORT / SORTBY / UNIQUE
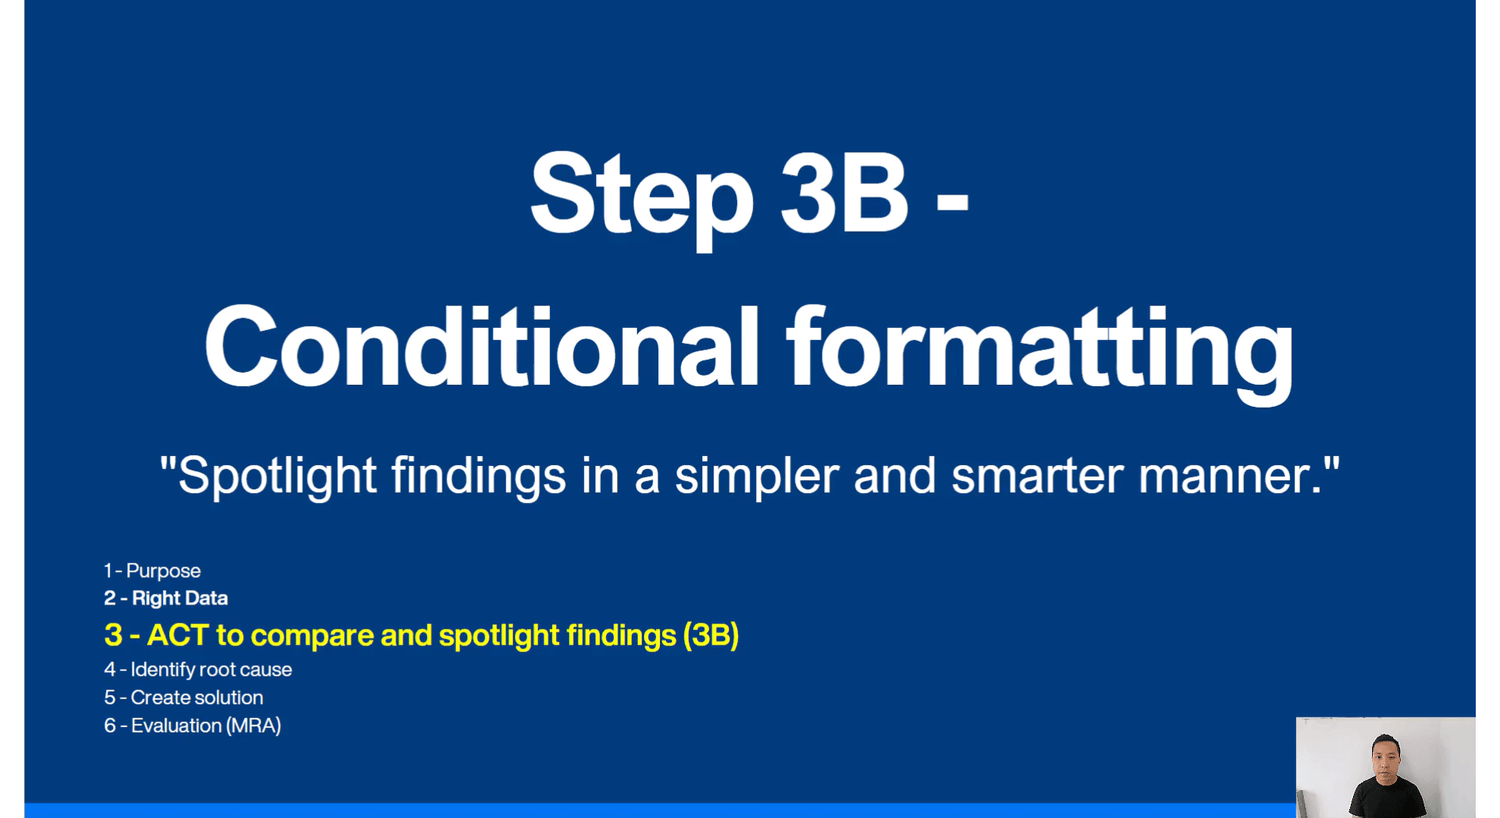
STEP 3B: Conditional Formatting
50 mins
Analyze & Spotlight: Finding the "Why" (Conditional Formatting).
Besides functions, we'll also explore conditional formatting. This will help us learn how to highlight, format, and visualize findings effectively using conditional formatting.
Highlight cells rules
Top / Bottom rules
Data bars
Color Scales
Icon sets
New rules
Custom number format
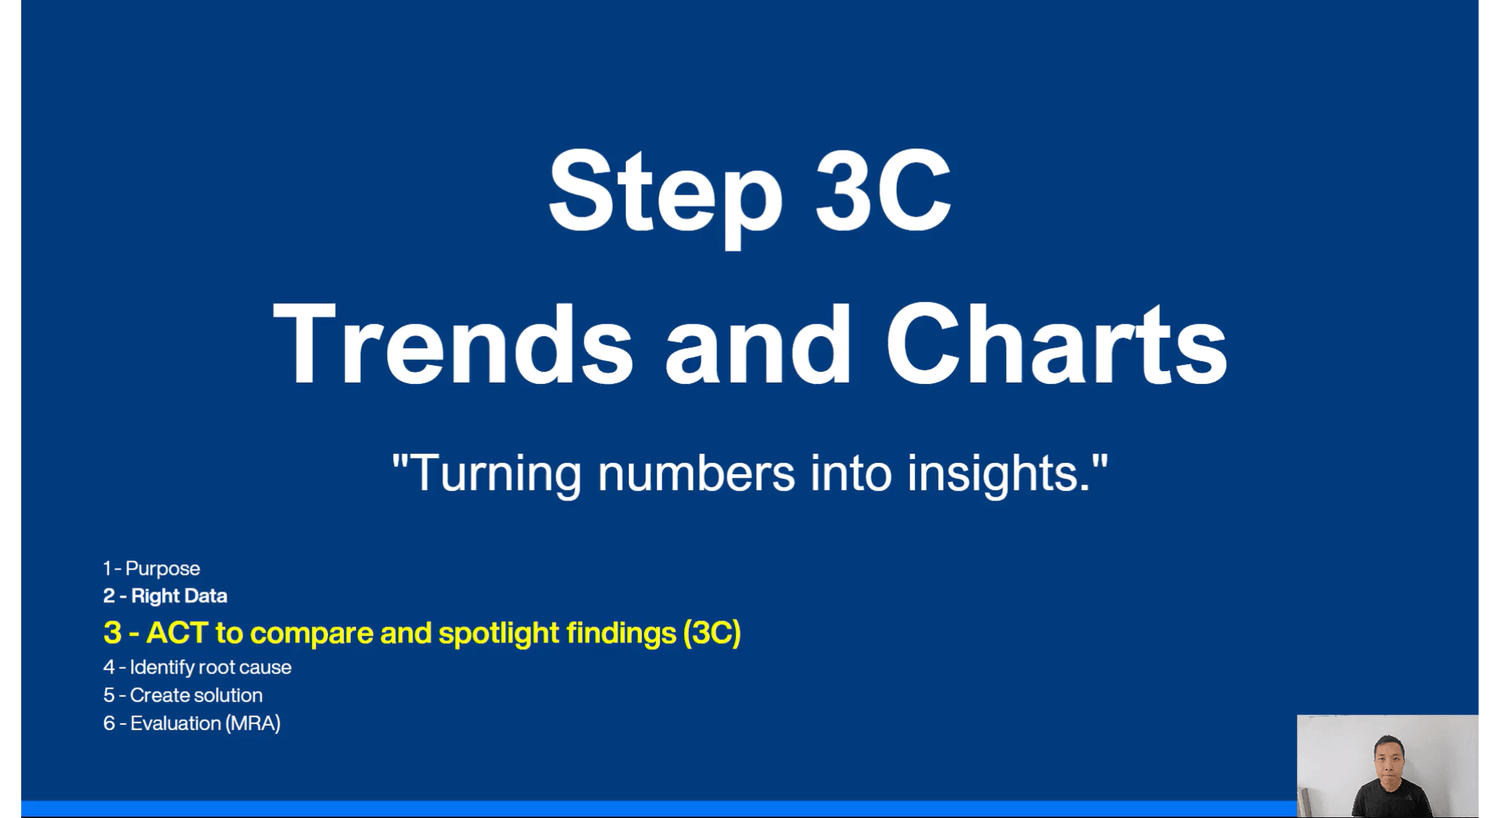
STEP 3C: Trends and Charts
1 hr 15 mins
Analyze & Spotlight: Finding the "Why" (Trends and Charts).
But there's more to it. We'll also get into creating dynamic charts, to uncover trends and insights.
Line chart / Bar chart / Combo chart
Auto-updated and dynamic charts
Conditional alerts and highlights
Sparklines
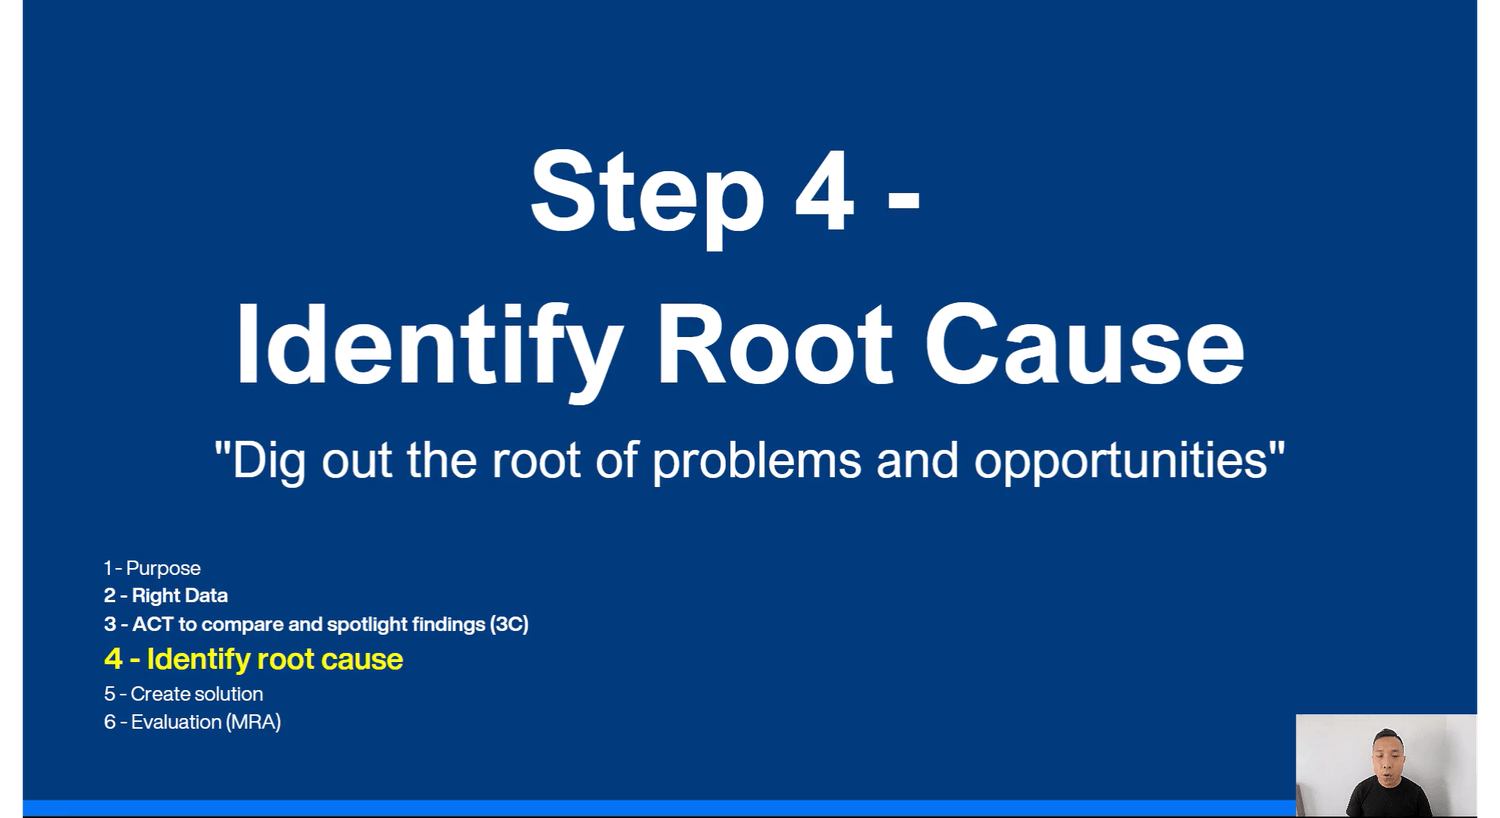
STEP 4: Identify Root-Cause (PivotTable)
60 mins
Drill-down mastery (Pivot Table power-user secrets).
Once we complete Step 3 on analyzing numbers, we'll dive into the world of PivotTables and management tools. We'll use these tools to drill down into the data and uncover the root causes that drive our actions.
Symptom vs Root-Cause
Dragging rows / columns / values / filters
Useful features in PivotTable
Slicers and timeline
Technique for drill-down analysis
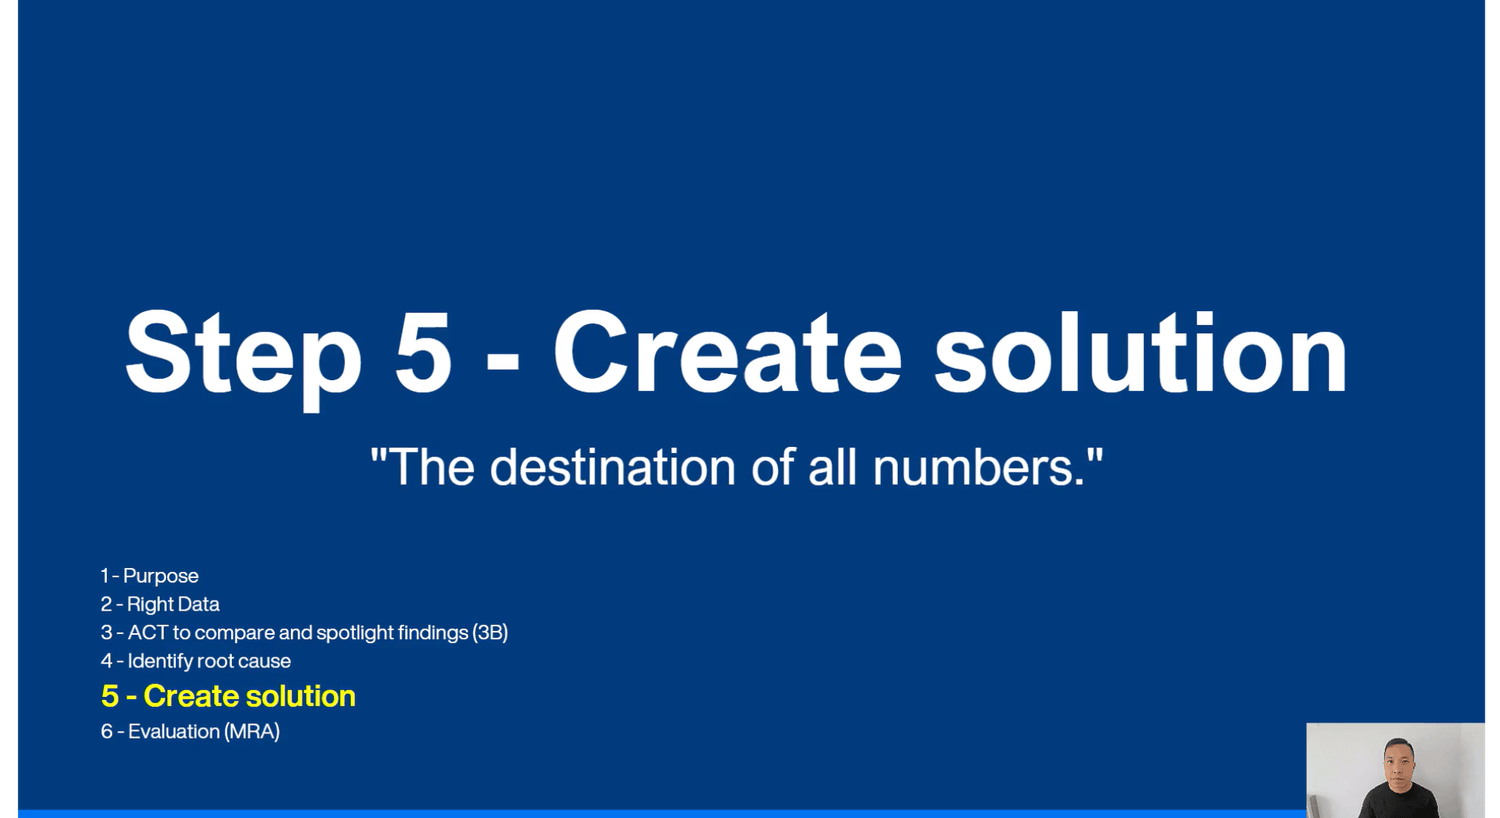
STEP 5: Create Solutions
18 mins
Solutions: The Executive Summary (How to communicate findings).
Now, based on the root cause, it's time to create solutions. In this step, you'll learn how to craft actionable solutions by setting goals, organizing your projects, and communicating effectively.
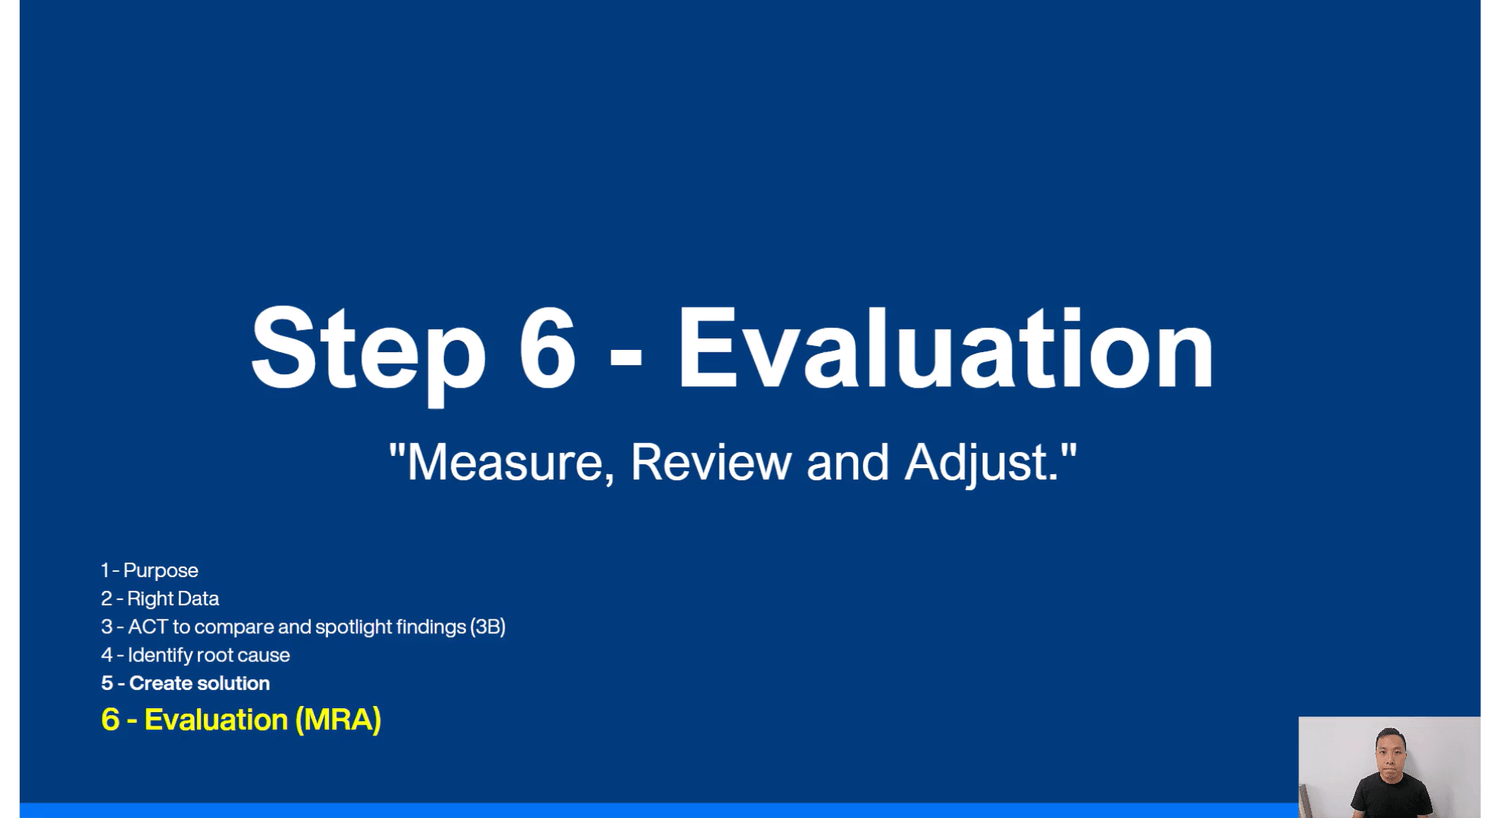
STEP 6: Evaluation (Measure, Review, and Adjust)
1 hr 15 mins
Evaluation: The Performance Dashboard (Build it once, use it forever).
Finally, we'll wrap it up by diving into creating a Pivot Dashboard to monitor the performance of your solutions. In this step, we'll cover the foundation and concepts of dashboards and delve into Pivot Charts.
Dashboard design and layout
Build business dashboard using PivotCharts
Charts and shapes controls
Comprehensive practice
Two Exclusive Bonuses (Value $398) 🎁
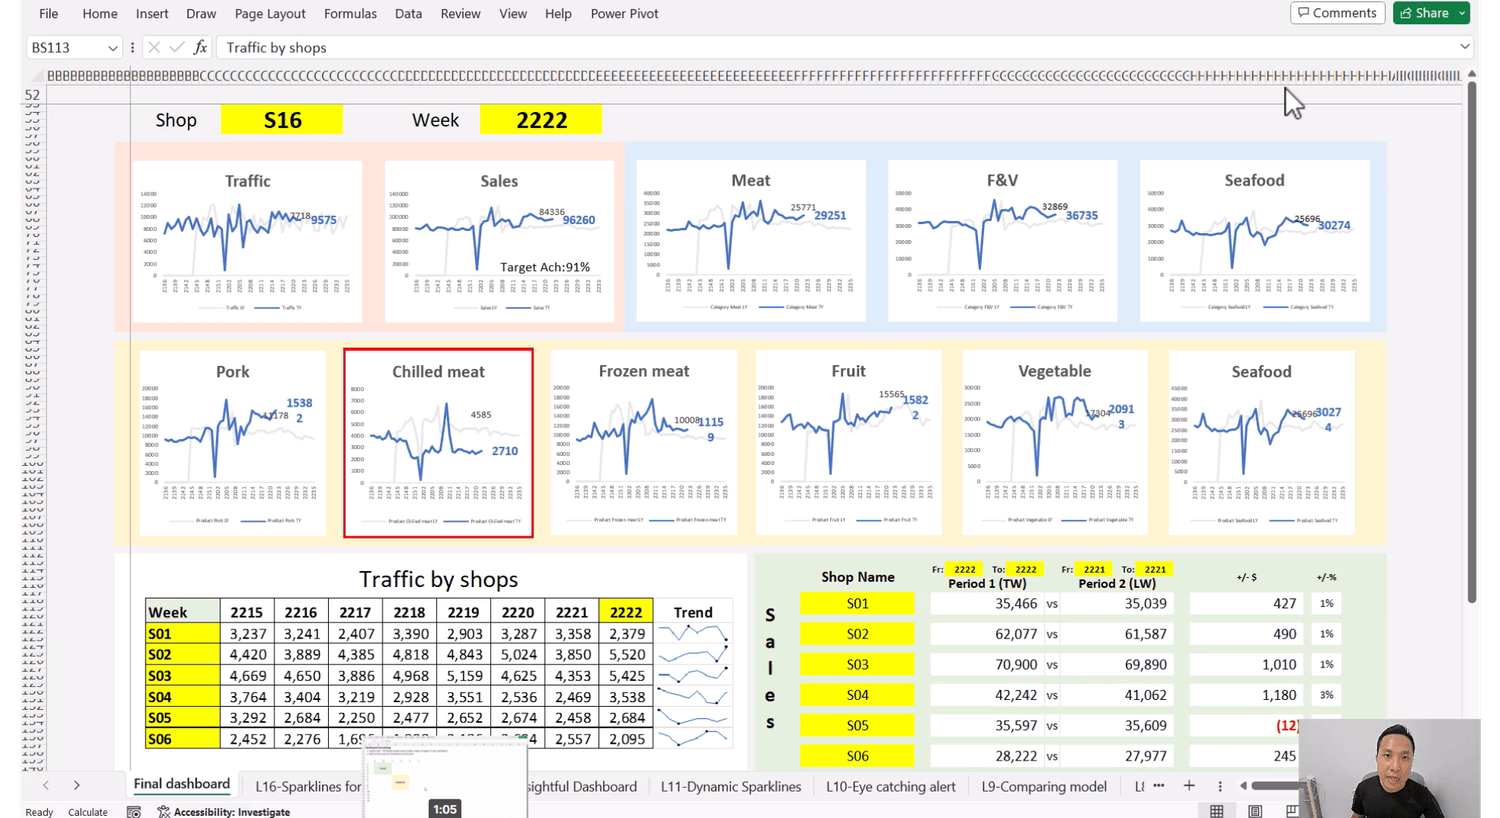
Bonus 1: Business Dashboard Masterclass (Value $199)
1 hr 30 mins
Goal: Build a business dashboard with only 3 functions in 1.5 hours
The course doesn’t end here.
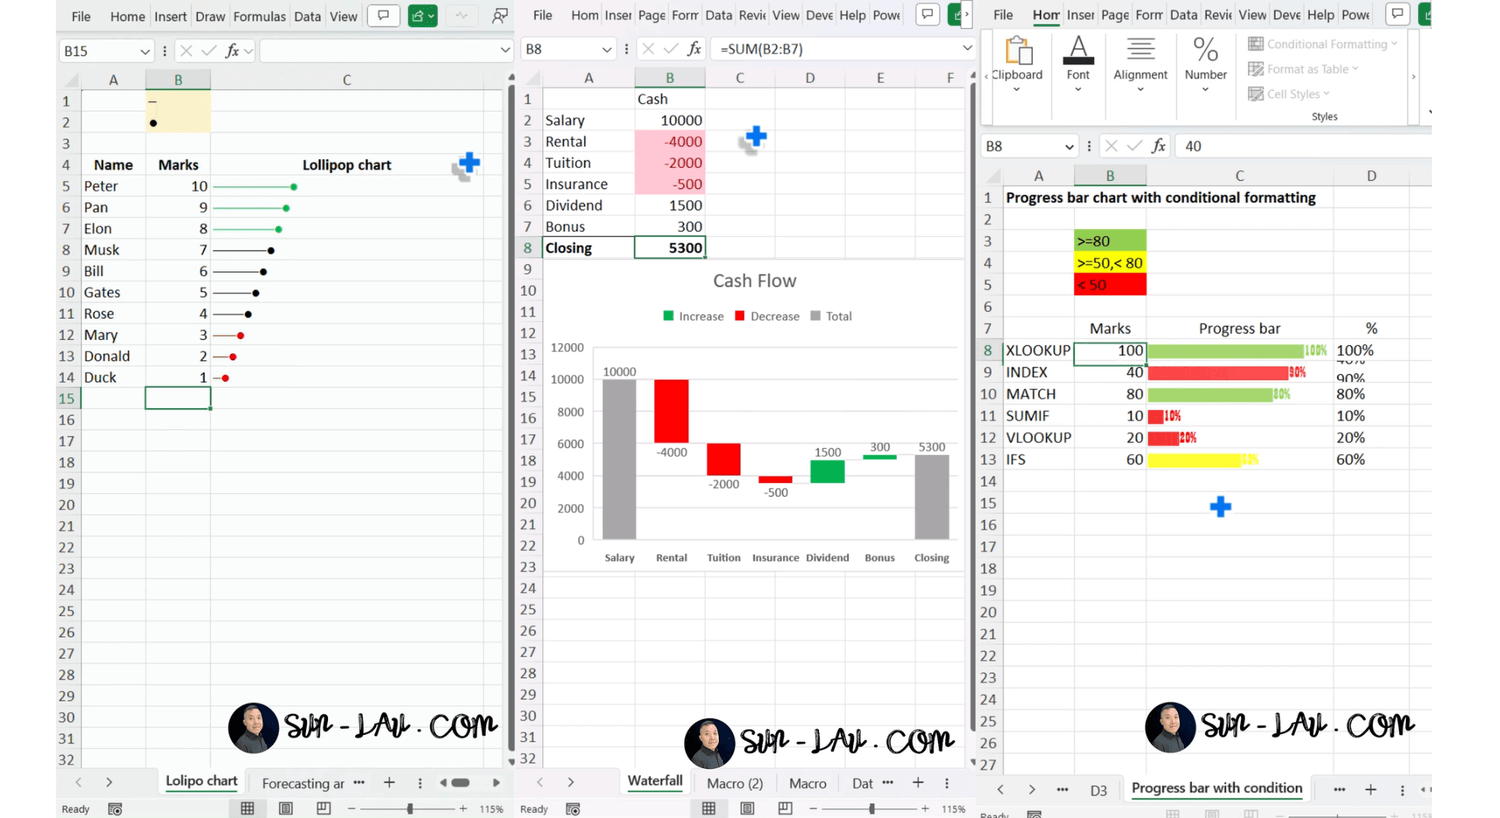
You’ll take it one step further—learning how to build a clean, powerful business dashboard using just 3 core functions. No PivotTables. No PivotCharts. Just smart Excel.
Bonus 2: 200+ Excel Analytics Power Tips (Value $199)
3 hrs
Goal: Mastering an advanced business dashboard using only 3 functions
The course doesn’t end here.
200+ Tips and Tricks Power Pack isn't a one-time thing. It evolves with you, providing lifelong updates filled with practical tips, advanced applications, and expert tricks to keep you ahead.
WHAT'S INSIDE ?
Try The OS For 30 Days.
If you haven't built a better model or saved at least 5 hours of work, I’ll give you a 100% refund. No questions asked.
Excel Analytics OS Masterclass ($599 Value)
Bonus 1: 3-Function Dashboard Masterclass ($199 Value)
Bonus 2: 200+ Power Tips Library ($199 Value)
Bonus 3: Lifetime Access ($99 Value)
Bonus 4: 85+ Practice Worksheets & Templates (Priceless)
Total Real World Value: $1096+
Exclusive Enrollment : $197
Guaranteed Results With Zero Risk
Excel MBA Bundle: USD $197
One-Time payment. ZERO risk. 30-day money back guarantee. Lifetime access and ongoing updates.
Signature Course Excel Analytics OS x 1 (Value $599)
8 modules, 121 short lessons, 7.5 hours
Bonus 1: 200+ Excel Analytics Tips with practice files ($199 Value)
Bonus 2: Masterclass - Creating Dashboard using only 3 functions ($199 Value)
Bonus 3: Lifetime Access ($99 Value)
Bonus 4: 85+ Practice Worksheets & Templates (Priceless)
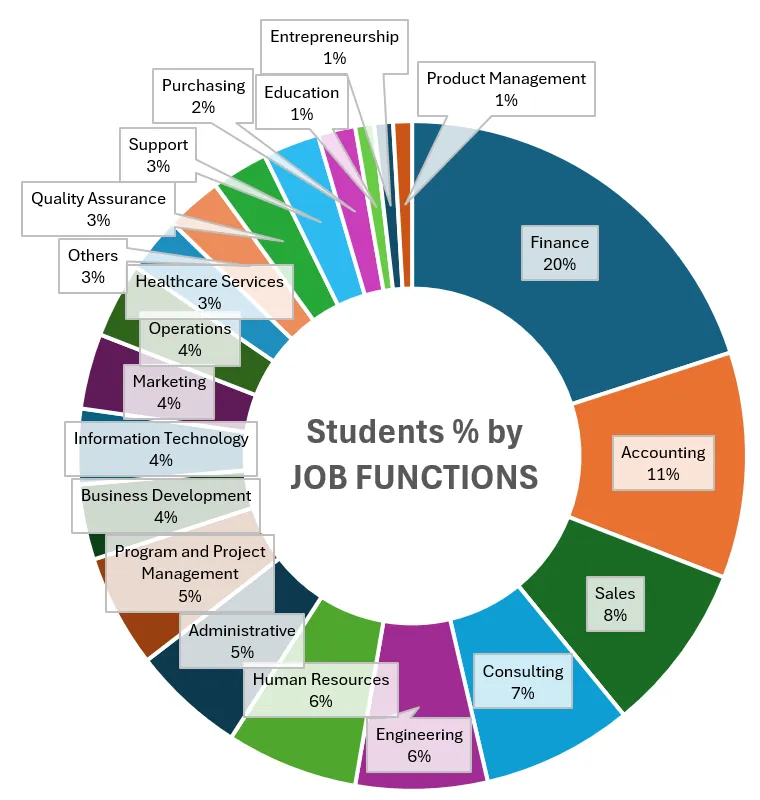
Students from 58 countries have enrolled! You're next!
Argentina, Australia, Austria, Azerbaijan, Brazil, Belgium, Cambodia, Canada, Cayman Islands, Chad, China, Denmark, Egypt, Estonia, Fiji, France, Germany, Greece, Hong Kong, India, Indonesia, Ireland, Isle of Man, Italy, Jordan, Kuwait, Lesotho,Libya, Malaysia, Malta, Mexico, Mozambique, Netherlands, New Zealand, Nigeria, Oatar, Oman, Pakistan, Panama, Philippines, Poland, Portugal, Romania, Saudi Arabia, Senegal, Singapore, Slovakia, South Africa, Spain, Sweden, Switzerland, Taiwan, Thailand, Turkey, United Arab Emirates, United Kingdom, United States, Venezuela.

Very good course. It was extremely efficient how Sun was able to provide so much insight into Excel's powerful tools in a course of 7.5 hours. Congratulations! I really appreciate you putting this course together.
Julio Ortiz, Fractional CFO
Student from United States
This course has helped me with my Excel analytical skills which I was hoping to build for years but didnt know where to start from. I am really grateful to Sun Lau for putting these together for their students, your little tips and tricks along the way are super helpful too. I highly recommend this course to anyone willing to learn or improve excel regardless of what level they are on. A big Thank you to Sun Lau.
Farah Fahad
Student from United Kingdom
I've finished Sun Lau's Excel Analytics OS course, without a doubt this course has made my vision of data analysis stronger and clearer, and I should also mention that the Excel Analytics OS course should be attended by those who expect more from themselves. Congratulations Sun Lau, the content has been marvellous for my personal and professional growth.
Paula Nogueira, Manager, Customer Service
Student from Portugal
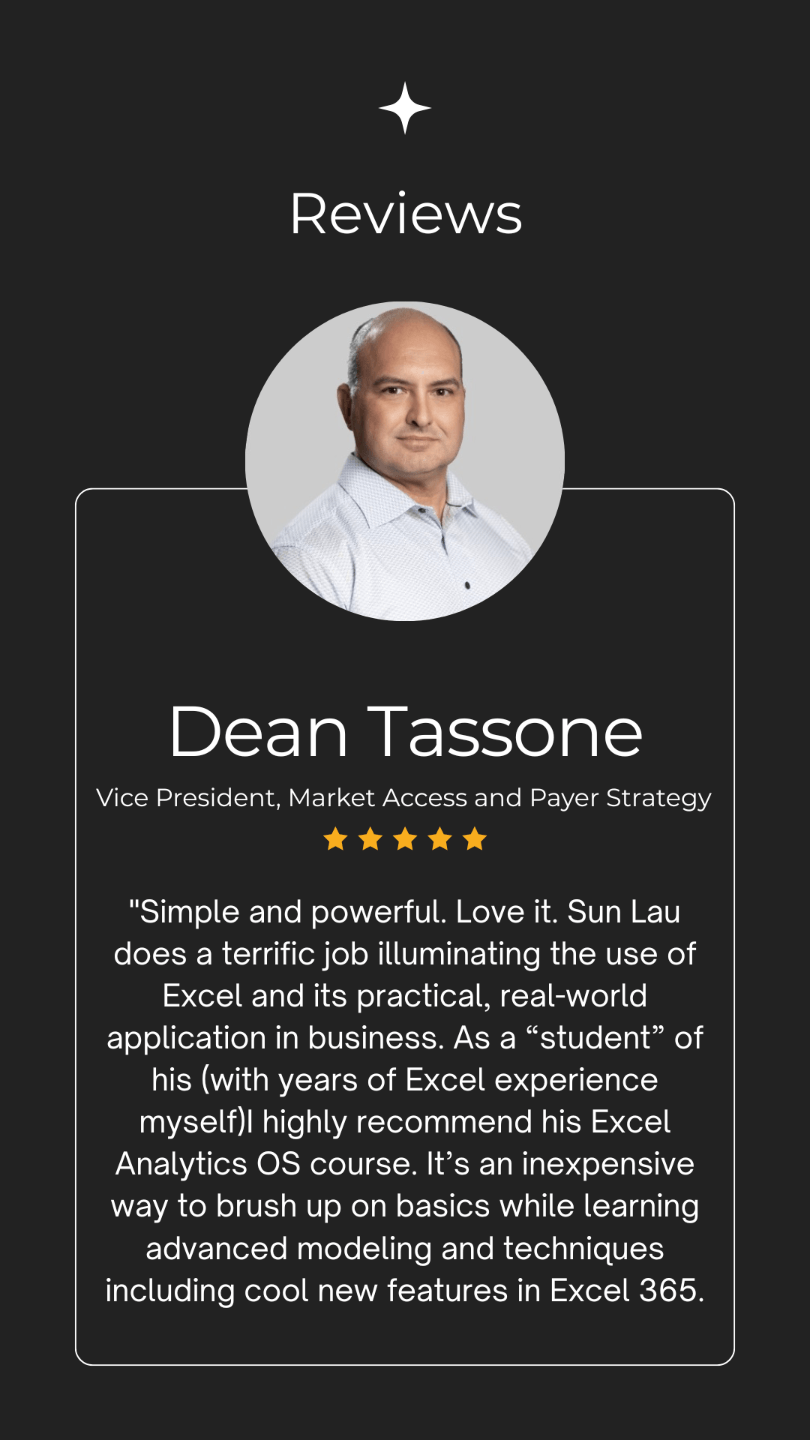
Students Are Loving The Course:
More LinkedIn Followers Are Saying:
FAQ
This is a video course that you can go through at your own pace. You'll have lifetime access to the full course, which is available on my online learning platform. You can watch it whenever and wherever you like.
It differs in three key ways from generic Excel courses:
1. Logic-first, not step-first — you understand why & when, not just how to copy formulas.
2. Condensed 20-year real-business experience, no outdated textbook drills.
3. The structured 6-step PrACTice system only covers the top 20% skills solving 80% of your office tasks.
No useless functions, just faster work and clearer career growth.
The course is designed for business professionals who have a few years of Excel experience. However, you can still start the course even if you are a beginner. No worries.
Guranteed results after completing the course. 30-day money back. No question asked.
This course is all about simplicity:
No unnecessary explanations.
No complicated lessons.
No VBA & PowerQuery.
No fancy stuff.
If you prefer straightforward and effective learning, this course is for you!
This course is meant for you to learn at your own speed. If you have any questions, feel free to email me anytime, and I'll get back to you as soon as I can.
Enjoy peace of mind with my 30-day money-back guarantee. If you ever decide to cancel your access in the first 30 days, simply email me at sun@sun-lau.com, and you'll receive a full refund.
Here's the basics:
Excel version: Microsoft 365
Language: Easy-to-understand English for all
Sure, you'll get a certificate when you finish 100% of the course!
Great choice! "GET INSTANT ACCESS" now! See you in the course!